Top 10 Quality Assurance Tools And Interactive Statistics For Your Training Dataset in 2024 | Ultimate Guide

Learn how to use best quality assurance and interactive statistical tools to perfect your custom training datasets and improve neural network performance.
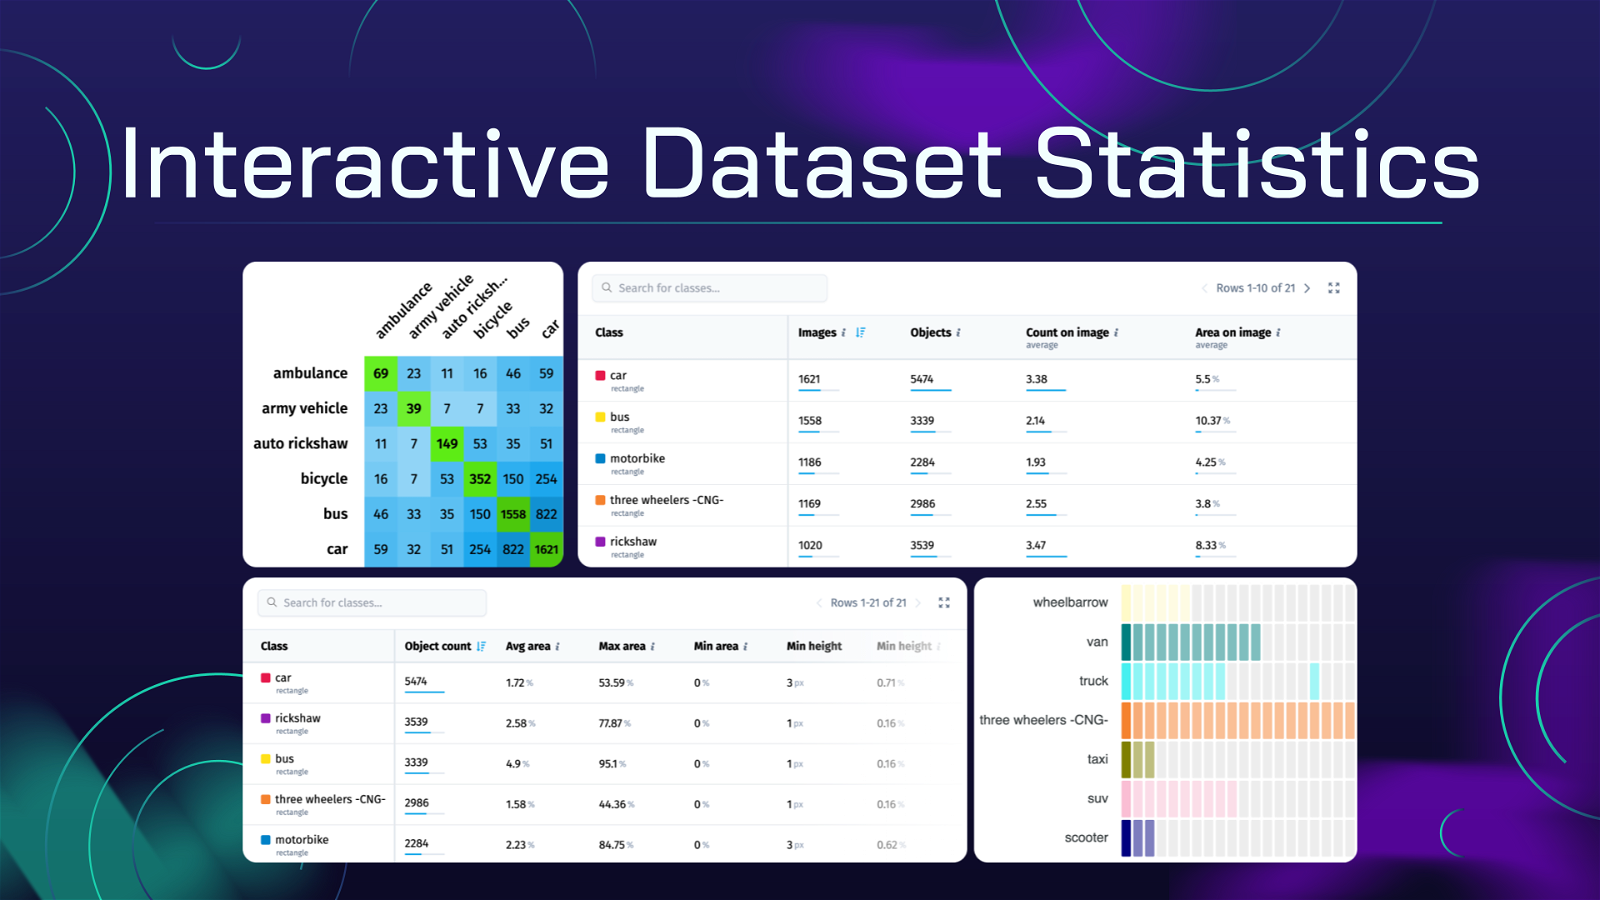
Table of Contents
Supervisely team is proud to announce advanced interactive statistics developed to improve your dataset analysis and perform efficient quality assurance (QA) for you custom Computer Vision training datasets.
In this comprehensive tutorial, you will delve into the statistical insights and learn how to interact with them to optimize your data validation process, uncover hidden anomalies, errors, annotation outliers, refining data acquisition process, draw the right conclusions on annotation distributions and much more.
It is worth noting, that the QA tools covered in this guide lead to clear data interpretability and, as a result, to accurate training datasets and precise models trained on them.
Discover the best interactive dataset statistics such as:
-
Class balance: Find out the distribution of classes in your dataset.
-
Co-occurrence matrix: Explore the relationships between classes.
-
Image statistics: Get detailed information about image characteristics and its objects.
-
Object distribution: Analyze the localization of objects in images with their properties.
-
Class sizes: Analyze the sizes of objects of all annotation classes in your dataset.
-
Spatial heatmap: Visualize the most frequent spatial location of objects and placement patterns in images.
-
Object statistics: Compare the characteristics of individual objects.
-
Other statistical measures: Explore additional properties and metrics specific to your dataset.
Video tutorial
Join us in this 4-minute video guide to explore new interactive quality assurance tools and automatic statistics for custom Сomputer Vision datasets in Supervisely.
Learn here about the benefits of interactive statistics, including training datasets quality assurance, exploring and validating annotations, visualizing data distribution, detecting outliers, finding labeling errors, and evaluating model performance.
For demo purposes in this tutorial we will use one of the main famous datasets in Computer Vision - the Pascal VOC dataset that showcases the advantages of our training data quality assurance tools.
Real-time statistics and interactive visualizations
Supervisely's Advanced Statistics are optimized to handle the datasets with millions of images and annotations in real-time. After initial calculation they are incrementally updated blazing-fast upon your request.
Real-time statistics allow users to view up-to-date metrics for their custom training datasets directly in the Statistics tab for every project in Supervisely. Continuously updated to include the latest data, these interactive stats enable data scientists and training data experts to promptly review and validate dataset quality to further train accurate Neural Networks and evaluate custom model performance.
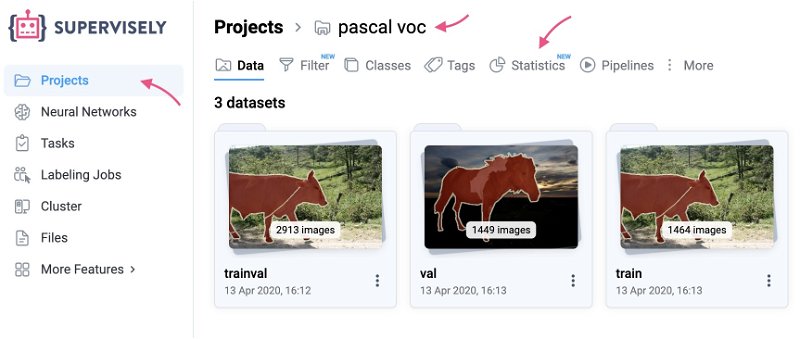 Open your project and click "Statistics" tab to navigate to quality assurance tools
Whether it's refining model prediction, adjusting dataset preprocessing steps, or evaluating performance, having real-time statistics and dynamic visualizations at your fingertips is critical to building production-level Computer Vision systems.
Explore dataset statistics for for better data understanding, click to the interesting metric, quickly review corresponding images and open annotation toolbox in a single click to modify or correct annotations.
Now that all current statistics in Supervisely can be updated in real-time, consider the following benefits:
-
By generating statistics on the fly, you get immediate insights into your dataset's characteristics without delay.
-
Real-time calculations enable you to adapt your data management strategies dynamically based on the latest dataset metrics, ensuring that your current annotation process remains accurate and effective.
-
Integrating real-time quality assurance tools into your workflow streamlines the data preparation process, allowing for quicker iterations and training data improvements.
-
By continuously renewing statistical measures as data is modified, you maintain accuracy in your analysis, leading to more reliable insights and model performance in result.
In addition, these functionalities make it easier for annotation team members to collaborate by providing a common framework for analyzing data and labels, exploring outliers, finding and fixing annotation mistakes. With real-time QA updates, everyone is working with the most actual information, supporting collaborative problem-solving and increasing overall efficiency.
Fast thumbnail preview for annotated images
Previewing thumbnails of annotated images is a fundamental step in working with any custom dataset of any size, and is essential to quickly analyze and visually validate data before training Deep Learning Computer Vision models. This process introduces you to the data and helps you inspect annotations, label properties, organization, and relationships. It allows you to identify potential problems, such as missing labels, outliers, imprecise annotations or glaring mistakes, that could impact your model training performance.
Clicking on any cell / row in the tables or charts allows users to preview corresponding images with annotations on top. It improves comprehension of the dataset by providing visual examples. After previewing the annotated images, users can seamlessly open all of them directly in the Image Annotation Tool.
Class Balance
In any dataset used for recognition, detection, classification or segmentation tasks, a proper knowledge of the class distribution is essential for model training and evaluation.
The dataset contains a variety of annotation classes, each representing different objects in the images. The class imbalance directly impacts the performance and generalization capacity of neural networks.
Analyzing the distribution of objects of all annotation classes provides insight into their prevalence and rarity, highlights under- and over-represented classes, allowing you to make changes in data acquisition process to annotate more object examples for under-represented classes as necessary for training the robust model.
The example table below shows the statistics and class balance for all classes in PASCAL VOC dataset. As you might see, person is the most frequent class and has 3476 objects while class aeroplane has just 436 annotated objects. It is almost 10 times less, and means that the model will detect persons way better than airplanes due to class imbalance.
Class imbalance table helps you to adjust and modify data sampling algorithms during training to automatically normalize classes distribution.
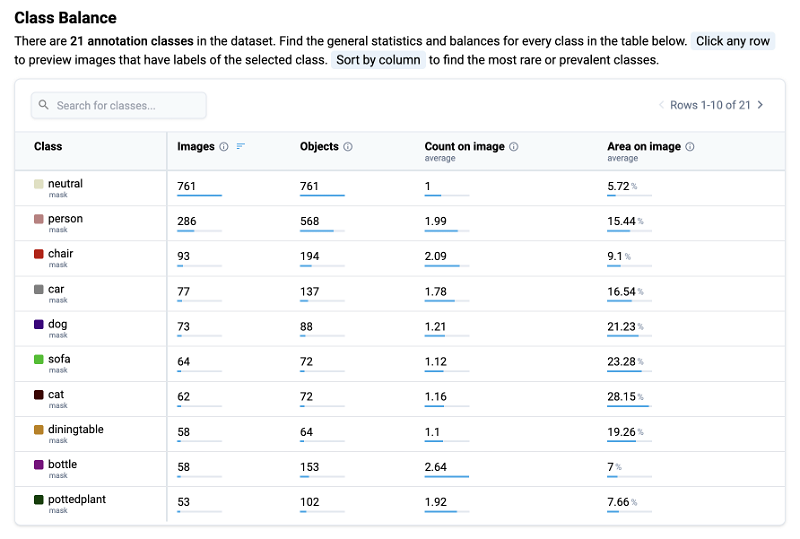 Class Balance statistic for the PASCAL VOC 2012 dataset
The following table offers a detailed insight into the class statistics in the dataset. Let's explain every column:
Class: Datasets can contain a large number of classes, in some cases thousands. The Class column lists the annotation classes present in the dataset. To view all available classes, just scroll the rows.
Images: Shows the total number of images that contain at least one object of the given class.
Objects: Presents the total number of objects of corresponding class in the dataset.
Average Count on Image: Provides the average number of objects on image for a specific class. This calculation excludes images without such objects.
Area on Image: Shows the average image area occupied by objects belonging to the given class. Images without such objects are excluded from this metric.
The table is interactive so you can just click any row to explore all images containing objects of a selected class. The Search function allows users to quickly filter and find specific classes in case of large number of classes in dataset. In addition, Sorting by specific column allows you to identify the rarest or most frequent classes.
Here are several use-cases for Class Balance statistics:
Model Training: Ensuring class balance distributions helps to customize training batch sampling procedure to reduce training bias toward over-represented classes, thereby providing balanced learning across all categories.
Data acquisition: Monitoring class imbalances helps data engineers to early identify priorities in the data acquisition process and adjust data collection requirements and approaches on the early stages.
Co-Occurrence Matrix
The Co-Occurrence Matrix is a powerful analytical tool that reveals the relationships between pairs of classes in a dataset. It provides valuable insight into how often objects of two classes appear together in the same images, shedding the light on potential interactions and correlations between classes.
In any image dataset, certain classes may co-occur frequently, indicating a semantic or contextual relationship between them. For example, in a dataset containing images of animals, classes such as cat and dog may frequently appear together due to their common presence in domestic environments.
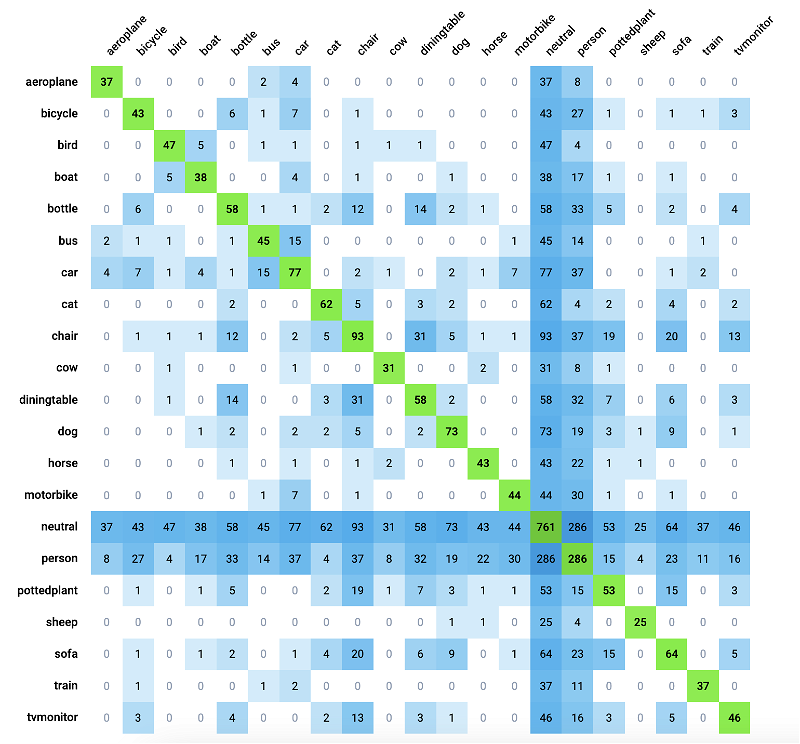 Co-Occurrence Matrix statistic for the PASCAL VOC 2012 dataset
In case of analyzing custom neural network performance, this matrix is called confusion matrix - where the rows are actual classes in the ground truth data and the columns are predicted classes. For example, the cell on the intersection of actual class cat (row) with the predicted class dog (column) with value 7 means that model misclassified (localization is good, but object classification is wrong) 7 objects: in the ground truth data there are 7 cat objects, but model predicted 7 dog objects.
Interactive Features
-
Matrix Cells: Each cell in the matrix represents the co-occurrence of two classes. The number within the cell indicates the number of images containing objects of both classes simultaneously.
-
Tooltip Explanations: Hovering over a cell reveals a tooltip explanation, making it easy for new users to interpret the matrix values and draw right conclusions.
-
Clickable Cells: Clicking on any cell in the matrix grants users access to corresponding images with annotations containing objects of both classes. This feature facilitates deeper analysis and understanding of class interactions, enabling users to explore visual examples of identified relationships.
The Co-Occurrence Matrix serves as a valuable resource for various Computer Vision tasks such as:
Semantic Understanding: By revealing class relationships, the matrix enhances semantic understanding of the dataset, uncovering underlying patterns and associations.
Data Augmentation: Understanding co-occurrence patterns enables the generation of synthetic data that preserves realistic class interactions, enhancing dataset diversity and model robustness.
Data Verification, Model Predictions Analysis, Classes Correlation, and many more.
Per image statistics
Analyzing images in the dataset based on the number of annotations for each class provides valuable insights into the distribution and characteristics of object instances. By examining the annotations per image across various classes, users can identify anomalies, edge cases, and patterns that may influence model performance and dataset quality.
The Images table provides detailed information about each image contained in the dataset:
Image - Each image is identified by a unique name or identifier.
Split - Images are categorized based on the dataset split they belong to, such as training, validation, or test.
Dimensions - Height and width dimensions of each image are provided in pixels, aiding in understanding the scale and resolution of the dataset.
Object Information - Detailed statistics on objects within each image are listed. This includes for every class in a dataset the number of objects presented on the image and the total area covered by those objects.
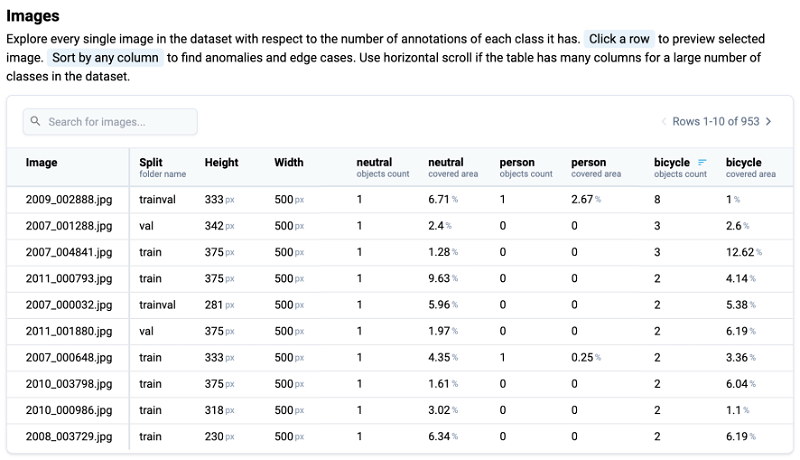 Image statistic for the PASCAL VOC 2012 dataset
Interactive Features
-
Sorting: Sort the table by any column to identify anomalies or edge cases, such as images with a high number of annotations of specific class or unusual object distributions.
-
Search: Quickly locate specific images or classes of interest within the dataset.
-
Preview images: Clicking on any row in the table allows users to preview the selected image with labels, allowing them to instantly locate an object or class of interest in the dataset.
Exploring Images by class annotations offers several advantages for dataset analysis and model development
Anomaly Detection: Quickly identify images with unusual annotation patterns or object properties, prompting further investigation or data cleaning if necessary. For example, sorting by class area may reveal the images, where the object may cover 99% of the image. Ability to quickly find and exclude from training such images will lead to improved model performance and robustness.
Quality Assessment: Evaluate dataset quality by examining the consistency and accuracy of annotations across images and classes. This process helps ensure robustness and reliability in subsequent model training. For example, annotation manager or annotation reviewer can sort columns for eny class, sequentially analyzing and validating annotation edge-cases: images with the maximum number of objects of class car, then for class person, etc.
Model Training: Customize model architectures and training strategies based on insights gained from the distribution of annotations across images and classes. This tailored approach improves the effectiveness and performance of machine learning models. For example, some images with unusual object properties can be sampled to validation sets, or completely excluded from the training.
Object Distribution
The Object Distribution Heatmap offers an interactive visualization of how objects are frequently presented across images for every class in the dataset. This heatmap chart exposes the images with unusual number of objects, facilitating detailed exploration and analysis of class annotations.
The heatmap chart presents the following axes:
Vertical Y Axis (Classes): Lists the classes presented in the dataset.
Horizontal X Axis (Number of Objects): Represents the number of objects on the image (e.g., 0, 1, 2, 3 objects, etc...).
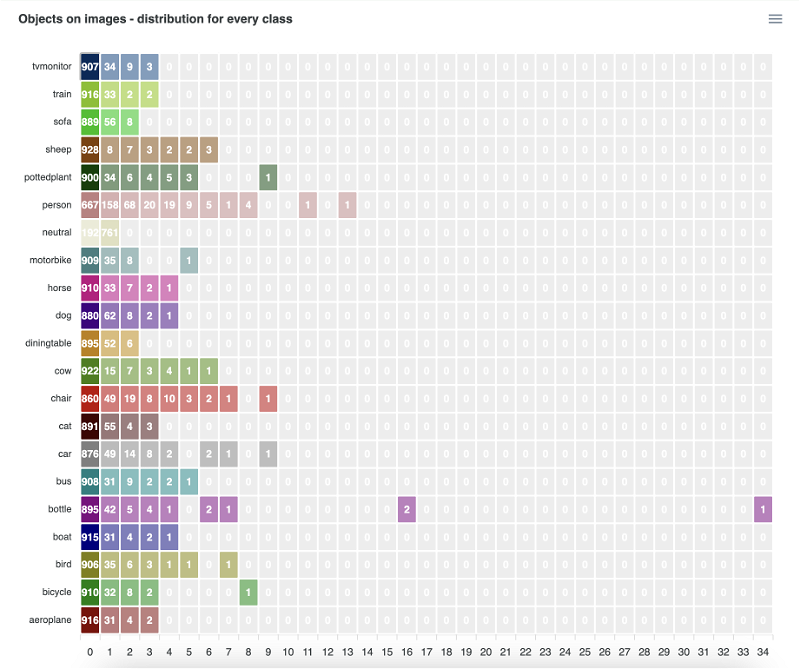 Object Distribution statistic for the PASCAL VOC 2012 dataset
For example, let's consider the row for class train (Y axis) and the column 3 objects (X axis). The cell on the intersection has the value 2 which means that there are only 2 images with 3 objects of class train simultaneously in our training dataset.
Once user hovers the mouse cursor over the cell, the helpful tooltip appears on the screen supporting users in interpretability and understanding of the selected value.
Clicking on that cell would display a list of all images in your dataset that contain only 3 objects labeled as train. This functionality enables users to quickly identify images with the exact number of object for a particular class.
Interactive Features
-
Click on cells: Clicking on a cell in the heatmap displays a list of images containing the specified number of objects for the selected class. This feature allows users to explore specific object distributions and analyze the corresponding images in detail in a thumbnail preview mode or open them in the image annotation toolbox.
-
Download Options: Users have the option to download the heatmap chart in various formats, including
SVG,PNG, andCSV, for further analysis or documentation purposes.
The Object Distribution Heatmap serves several purposes
Annotation Analysis: Gain insights into the distribution of objects across images for each class, aiding in understanding dataset characteristics and annotation patterns.
Data Exploration: Explore and easy navigate images with specific object counts for detailed examination and quality assessment. The same functionality can be achieved with the advanced conditional dataset filters but the filters will not show the big picture about general objects distribution across all classes in dataset - just a single cell from the heatmap.
Anomaly Detection: Identify anomalies or edge cases, such as images with unexpected or enormous number of objects, for further investigation, data refinement or additional data acquisition.
Object Class Sizes and Overall Properties
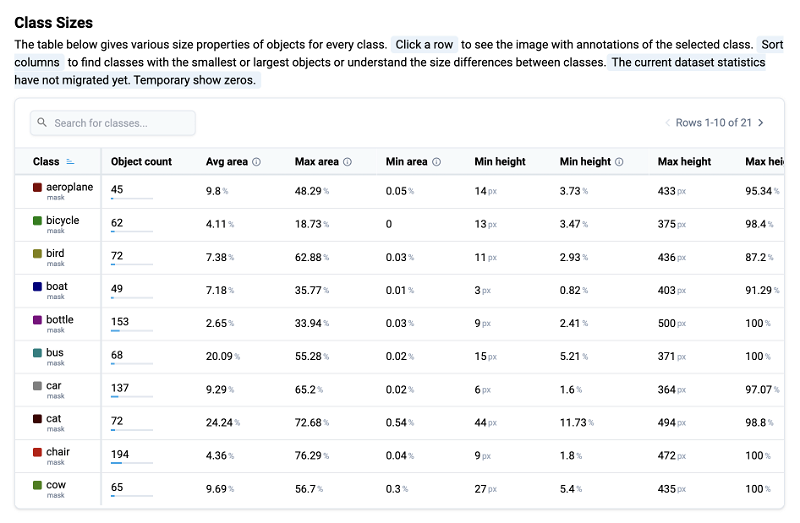
The Class Sizes table provides detailed size properties of objects for each class in the dataset, offering insights into their dimensions and size variations. Users can interact with the table to examine various size metrics and view images with annotations of selected classes, facilitating comprehensive analysis and fast data understanding.
The table presents the following properties for each class
Class: Name or identifier of the class.
Object Count: Total number of objects of the class in dataset.
Avg Area %: Average object area as a percentage of total image area.
Max Area %: Maximum object area as a percentage of total image area.
Min Area %: Minimum object area as a percentage of total image area.
Height (Min/Max/Avg): Object height presented as number of pixels and percentage of image height. There are three different columns for minimum, maximum, and average values.
Width (Min/Max/Avg): Object width presented as number of pixels and percentage of image width. There are three different columns for minimum, maximum, and average values.
 Class Sizes statistic for the PASCAL VOC 2012 dataset
Interactive Features
-
Clicking on Rows: Clicking on a row allows users to view images with all object annotations of the selected class, simplifying visual examination, analysis or correction.
-
Sorting Columns: Sortable columns enable users to identify classes with the smallest or largest objects, as well as understand size differences between classes.
The Class Sizes table can be used to inspect custom Computer Vision training datasets by all types of users from data scientists and annotation teams or domain experts for:
Size Analysis: Understand the objects size properties and variations within each class, aiding in dataset exploration and annotation quality assessment.
Comparative Analysis: Compare object size properties across different classes to identify patterns, find unusual object shapes and structures. This information provides valuable insights and timely inform data acquisition or labeling teams about the need for changes in data pipelines.
Anomaly Detection: Identify classes with unusual size properties or outliers, enabling targeted investigation and data refinement.
Class Area Sizes in Treemap view
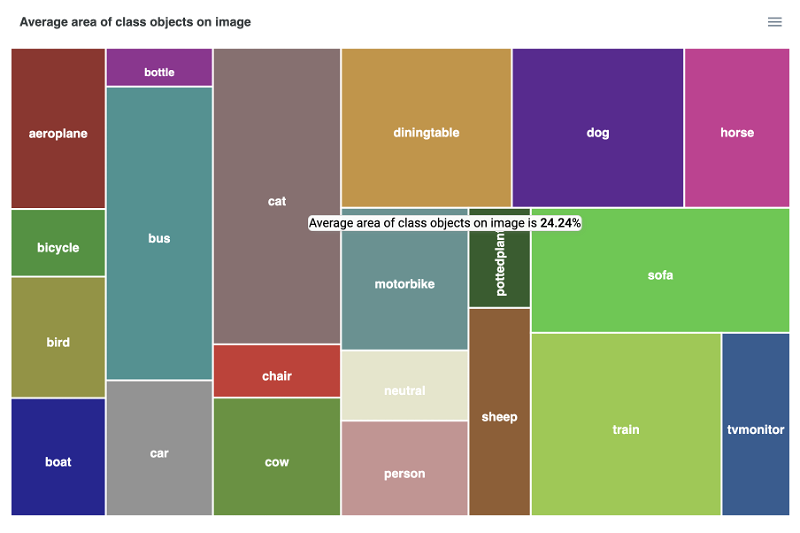
The Class Area Sizes Treemap offers an alternative visualization method for understanding the properties of object sizes for all classes in the dataset. This interactive chart presents class area sizes in a 2D layout, allowing users to explore the relative proportions of object areas for each class and helps to perform fast visual analysis and inspection.
The Treemap chart presents the following components:
2D Layout: Classes are represented as rectangles, with larger rectangles indicating classes with greater average object area sizes.
Color Coding: Each class rectangle is color-coded for easy identification.
Tooltip Information: Hovering over a class rectangle displays additional information, such as the class name and average objects area size.
 Class Area Sizes Tree Map statistic for the PASCAL VOC 2012 dataset
Interactive Features
-
Hovering on Rectangles: show the tooltip for easier understanding.
-
Downloading Options: Users have the option to download the Treemap chart in various formats, including
SVG,PNG, andCSV, for further analysis, sharing or documentation purposes.
Spatial Heatmap
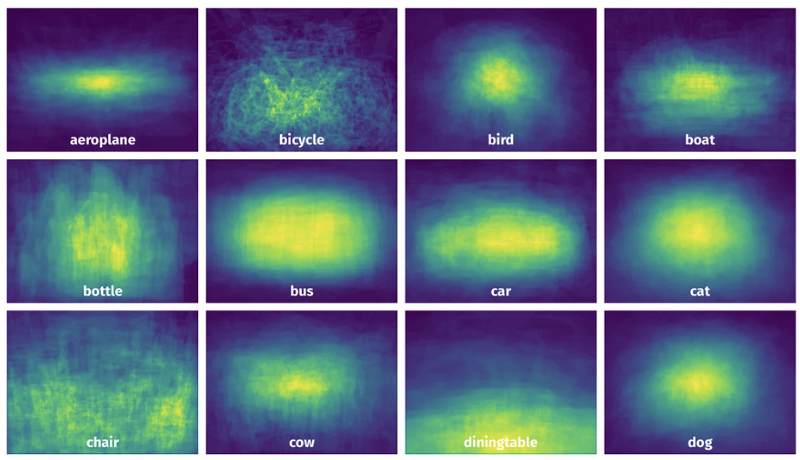
The heatmaps below show the average spatial location of all objects for each class. These visualizations help to understand how objects are distributed on the images highlighting most common and rare object locations. It helps to analyze the placement of objects in a dataset.
These statistics are mostly relevant for spatial datasets for such Computer Vision tasks as object detection, semantic segmentation, instance segmentation, panoptic segmentation, etc. For example,m as you can see on the image below, objects of class airplane are mostly located in the center of the image. Knowing that information will help data scientists to configure custom data augmentations to train the model that will be robust to airplane locations, and as a result will be able to predict airplanes on any position, not only in the center of the image.
 Spatial Heatmap statistic for the PASCAL VOC 2012 dataset
Anomaly Detection: By identifying outliers and spatial unusual patterns using the Spatial Heatmap, researchers and practitioners can detect anomalies in the dataset. These anomalies may represent errors in labeling, uncommon occurrences, or areas of interest that require further investigation. For example, cars objects can not be located in the sky and should be presented in the zones of the road.
Localization Accuracy Assessment: Spatial Heatmaps serve as a tool for evaluating the accuracy of object localization algorithms. By visualizing the predicted object locations on the heatmap, analysts can assess how spatially distributed model predictions compared to average class objects locations in the ground truth.
Region of Interest (ROI) Identification: The Heatmap analysis facilitates the identification of image regions that contain a high density of specific objects. These regions, known as Regions of Interest (ROIs), are areas where certain objects are concentrated, providing valuable insights into the salient features of the dataset.
Objects Properties
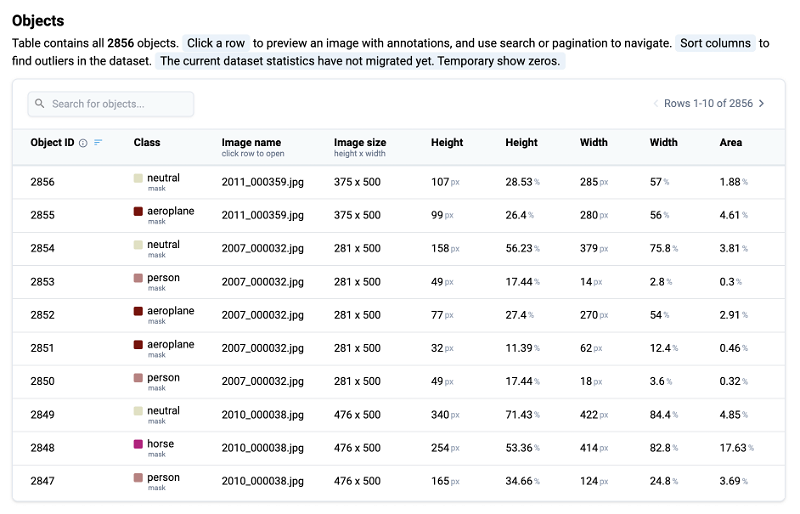
The Objects table contains all objects and their geometrical properties. Users can preview images with specific label by clicking on a object's row, utilize search and pagination features for navigation, and identify outliers by sorting by specific column.
The table presents the following information for each object:
Object ID: Unique identifier assigned to each object.
Class: Indicates the class (category) to which the object belongs.
Image Name: By selecting a row, users have access to the associated image, with a preview of the image annotations.
Image Size: Displays the dimensions of the image in height and width, and allows to compare the object size with respect to the size of the image.
Height (%/px): Indicates the object's height relative to the image height, expressed as a percentage or pixels.
Width (%/px): Specifies the width of the object relative to the width of the image, expressed as a percentage or pixels.
Area: Shows the area occupied by the object, expressed as a percentage. This metric provides insight into the extent of coverage in the image.
 Objects statistic for the PASCAL VOC 2012 dataset
Interactive Features
-
Click on Rows: Clicking on a row opens the related image, allowing users to visually inspect annotations and object properties.
-
Search: Use the search function to quickly locate specific objects or classes of interest in a dataset.
-
Sortable Columns: Sortable columns allow users to identify outliers or patterns in object characteristics, such as extreme height or width values. For example, user can find and inspect the largest and the smallest objects in the entire dataset.
The Objects table serves several purposes for dataset analysis and exploration
Annotation Inspection: Find specific objects and preview images with annotations to understand object characteristics and spatial relationships with another objects on the scene.
Outlier Detection: Identify objects with extreme or unusual height, width, or area values, which may indicate errors or anomalies in the dataset.
Granular inspection of objects: You can easily find objects deviating from the normal. For example if object covers entire Scene. It may affect model training performance.
Image and object tags and attributes
The co-occurrence matrix for image and object tags and attributes provides a rich analytical view of the relationships between different tags and attributes associated with both images and objects in a dataset. It provides a comprehensive overview into how different tags and attributes tend to co-occur, shedding light on potential correlations and trends in the data.
Also it help to find the images that have both tab "A" and "B". It help on analyzing datasets for image and object classification Computer Vision task. In you work in the settings of classical classification, you may find the mistakes in your datasets - co-occurence matrix has to be diagonal. For the multi-label classification it uncovers the correlation between all tag pairs. Find the example below for the MVTec Logical Constraints Anomaly Detection dataset.
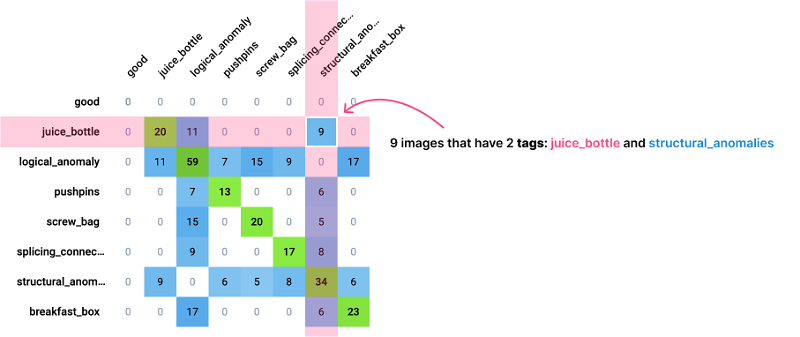 Image and object tags and attributes Co-Occurrence Matrix for the MVTec Logical Constraints Anomaly Detection dataset
Interactive Features
-
Matrix Cells: Each cell in the matrix represents the co-occurrence of two tags or attributes. The numeric value in the cell indicates the number of images in which the pair of tags (attributes) co-occur.
-
Tooltips: Hovering over a cell provides a tooltip that shows the degree of co-occurrence between the tags (total number of images).
-
Clickable Cells: Clicking on any cell in the matrix allows users to view corresponding images containing the selected pair of attributes.
Class and tag association| Co-Occurrence Matrix
The class and tag association statistic provides a comprehensive view of the associations between different classes, their objects and tags assigned to the objects. This matrix shows the big picture on which tags are commonly associated with objects of specific classes, allowing users to understand the semantic relationships between the object classes and the descriptive attributes assigned to them.
In Computer Vision datasets for object multi-label classification tasks objects on images may have more than one tag assigned, certain tags may frequently co-occur with particular classes, indicating the descriptive attributes commonly associated with those classes. For example, in a dataset of live-stock images, the class cow may be associated with tags such as age, size, health condition and pose type which reflect the typical characteristics of the cows for animal health and well-being monitoring systems.
Class and tag co-occurrence matrix provides a powerful way to explore relationships between objects and the attributes assigned to them.
Tag-based Search: Understanding class-tag associations enables efficient content-based objects search, allowing users to search for images based on specific object class+tag combinations.
Object Properties: The matrix simplifies data analysis by providing insight into the distribution of descriptive attributes across classes, supporting tasks such as data analysis and content categorization.
Categorical Key-value Tags Distribution
In Supervisely, you can create categorical (OneOf) key-value tags and use them in various Computer Vision tasks, such as image retrieval and classification. These tags have the defined set of possible values. For every tag in the dataset, categorical tag distribution chart shows the number of objects and images, that contain this tag with its specific value. This chart provides a clear view of how frequently different values of the categorical tags occur in the dataset. All cells are clickable and the corresponding images with their annotations will be opened in dialog window in thumbnails preview mode.
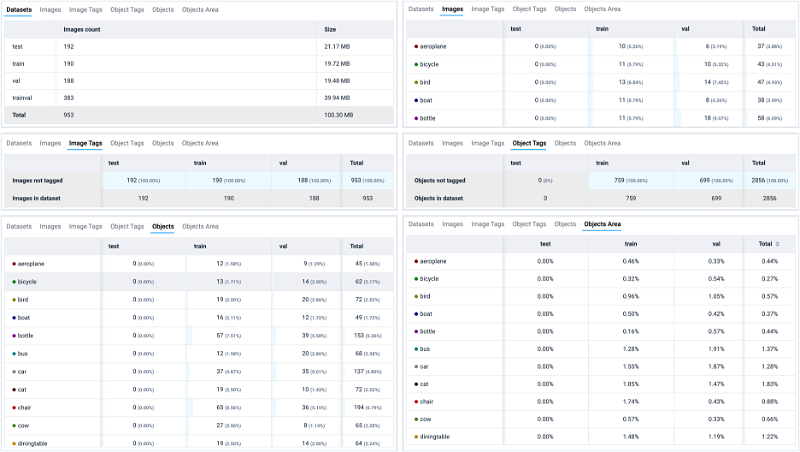
Other Statistics
Additionally, apart from the tables mentioned earlier, data scientists can easily spot some basic stats for training data, covering Datasets, Images, Image Tags, Object Tags, Objects, and Object Area. These basic statistics shows general characteristics of the data and annotations.
 Other statistics for the, PASCAL VOC 2012 dataset
Actions with the filtered data
These quality assurance tools can be used as a specific advanced visual filters allowing users to quickly explore and subsample data with very specific properties. With dataset filters, statistics and quality assurance tools users can easy manipulate the data, performing different actions on images and their annotations in Supervisely Computer Vision Platform: copy, more, delete, create labeling jobs, search similar images or assign tags and attributes. Supervisely is designed as a full-stack solution, thus the combination of:
streamline data management and labeling workflows, facilitate user collaboration and boost the speed of the data labeling, data review and model training loops. As a result, custom pipelines for Active Learning and Continuous Model Improvement can be organized smoothly.
Use cases - identifying outliers
Detect anomalies and deviations in annotation, that could impact the integrity and reliability of your training data. Examples of such data outliers include missing annotations, mismatched objects on the images, and disagreements between model predictions and ground truth annotations. By identifying and correcting these errors, you can ensure the quality and reliability of your dataset for model training.
Example 1. Missing or misclassified annotations
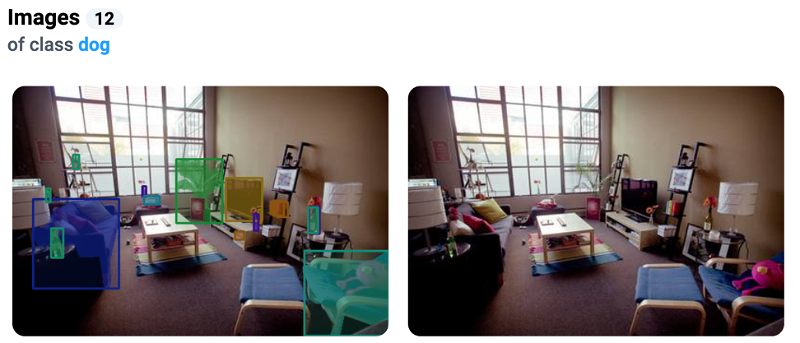
When analyzing the class dog, it is found that the selected class is presented on 12 images. However, when reviewing these images, it is found that there are no actual objects related to this class in one image. This may indicate problems with the clarity of the annotation or insufficient quality of the data labeling - annotators put the bounding box of class "dog" but there are no dogs on the image.
Example 2. Mismatch in the number of objects
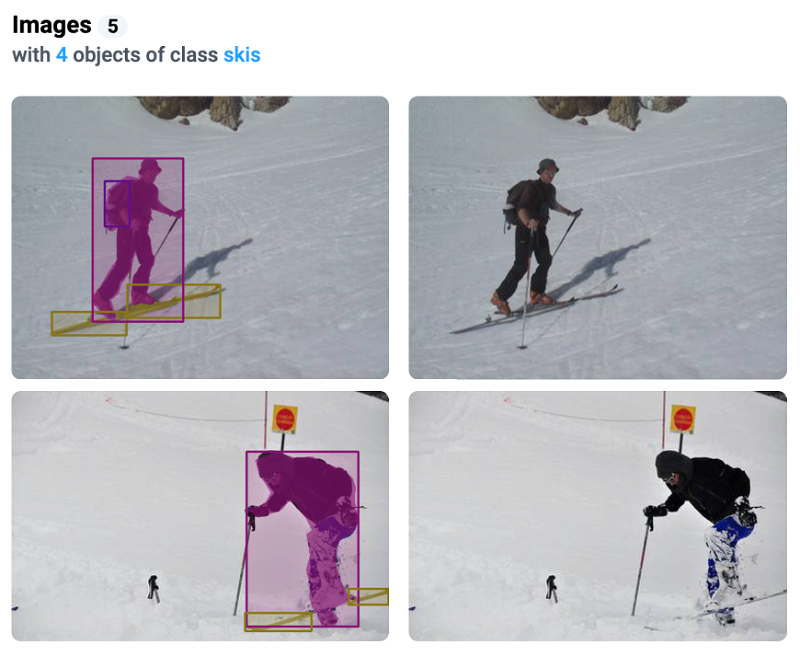
When sorting the images by the Object Distribution for the class skis, it is found that all of images have 4 objects in this class. However, a detailed view of some images reveals that they do not contain such a large number of objects of the class skis. This may indicate errors in objects segmentation (one object is partially covered and labeled as two separate masks), objects duplication or a mismatch between the actual content of the images and their annotations.
Example 3. Errors in model predictions
Quality assurance tools can be used to quickly expose and review anomalies in model predictions.
When reviewing objects co-occurrence matrix, data scientists can investigate unusual object pairs: for example horse and chair are presented on the image at the same time. It may help to find errors in training data. Or this may indicate that the model is not working properly or that there is a lack of training data for certain classes.
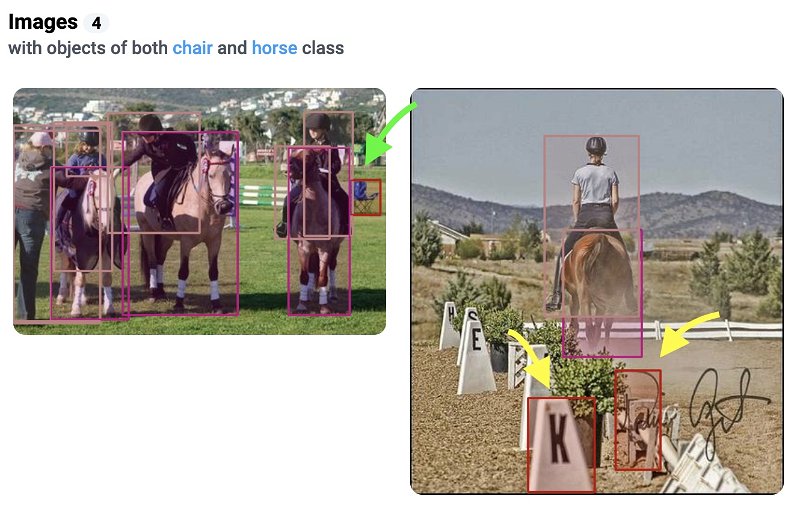 Green arrow - model correctly detected the chair on the left image. Yellow arrows - errors in predictions, objects are not chairs on the right image.
The purpose of analyzing the statistics for model predictions is to debug model mistakes and to determine what data needs to be added to training dataset of how training data augmentations can be improved. For example, having found a lack of images with objects of the class chair, a decision can be made to expand the training dataset by acquiring and labeling more images for this class to achieve a better class balance distribution and quality of the model.
Conclusion
By leveraging Supervisely's interactive quality assurance and statistical tool for custom training datasets in Computer Vision, users can gain deep insights into their data, uncovering valuable patterns and anomalies that drive informed decision-making data verification and correction process. Whether identifying class imbalances or exploring object distributions, our comprehensive statistics and visualizations empower users to optimize their datasets to improve model performance and accuracy for production systems.
Supervisely for Computer Vision
Supervisely is online and on-premise platform that helps researchers and companies to build computer vision solutions. We cover the entire development pipeline: from data labeling of images, videos and 3D to model training.

The big difference from other products is that Supervisely is built like an OS with countless Supervisely Apps — interactive web-tools running in your browser, yet powered by Python. This allows to integrate all those awesome open-source machine learning tools and neural networks, enhance them with user interface and let everyone run them with a single click.
You can order a demo or try it yourself for free on our Community Edition — no credit card needed!
Liked this blog post? Share it!


Subscribe to new blog posts
Table of Contents
🤖 Try Supervisely: it's free!
Full stack platform with hundreds of Apps ready to solve any computer vision task: from labeling to model training. Create account


